

When you’re a school faced with a crisis, gathering input is important. Opinions from your students, staff, parents, etc… can change and evolve over time and we need to be able to track them to be agile in improving our schools. The problem is, collecting survey data feels messy, particularly when we are gathering individuals’ unique perspectives. In response, we frequently adjust our surveys to make the analysis easier: restricting choices in a question or making the question somehow numeric (like a rating scale).
Another route some people go is doing a full on Qualitative Analysis, which can help you make sense of free response questions through coding transcripts, finding themes and patterns, and summarizing the findings.

Now imagine wanting to have individual voices heard (without restricting responses) throughout your whole community at regular intervals. Coding and summarizing seems like you’d need a full time team. I believe free response questions are powerful. It stops us from putting words in our respondents’ mouths. So I have an alternative approach: Topic Modeling.
Previously, in our discussion on distance learning, I did a small example of coding and summarizing and I did a small example on uncovering emotions in survey responses. This time, I’d like to analyze what is actually being said with only a single free-response question:
“How is Distance Learning going for you?”
The technique I’m going to use has a fancy name called Latent Direchlet Allocation, or LDA for short. It basically works like this:

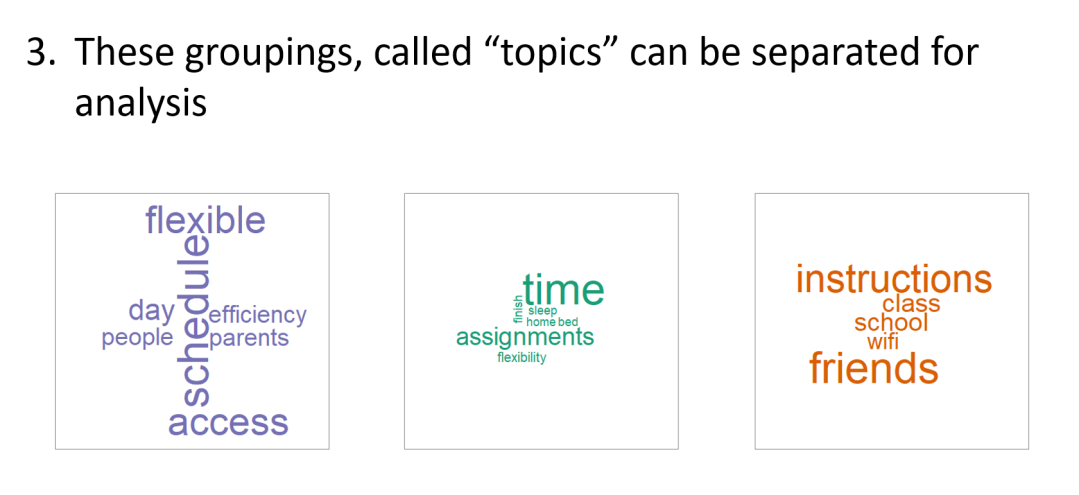
The LDA algorithm (run by a computer) creates the topic groups for us, now its up to us to use the knowledge of our field to give these topics labels. I might give category names like “At Home Learning Environment”, “Independent Learning” and “Systems of Support” for purple, green, and orange respectively.
This is similar to coding in qualitative analysis, except we didn’t go searching through transcripts for patterns. We let a computer do it for us. Why did the computer break it into three groups? It didn’t. I did. That was a choice I made when I ran the algorithm using two methods called “perplexity” and “coherence”, which is an article for another time.
Notice we started with one question, and it seems student responses revolved around these three “topics”. We can now analyze each topic, perhaps with another sentiment analysis, to see where the biggest area of need is:
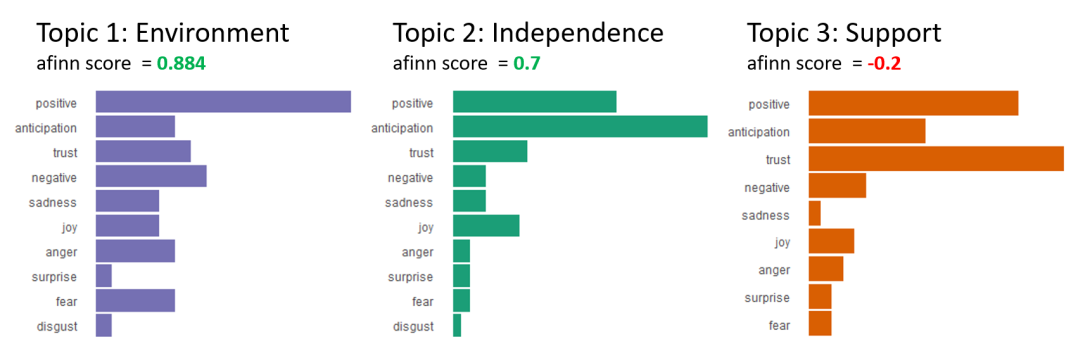
Through the collection of free response surveys, our results show that we may want to focus our energies on our systems of support (by the lowest afinn score), but that our students trust in the supports provided. Our results hint that being in charge of their own learning, topic 2, causes the most anticipation, and so we may want to spend energy on activities that help students manage the ambiguity and feel confident in managing their own learning.
Using Topic Modeling allows us to gather unbiased perspectives by maintaining the value of free response questions. It gives our respondents a voice for input and change and allows us to hear their unfiltered thoughts and opinions.