

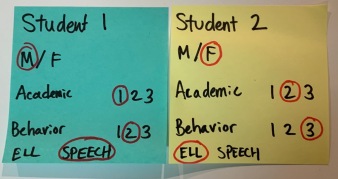
Let’s start at the end so we can get to the beginning. Typically, at the end of the school year, in schools where I have worked, we have collected and organized data with regards to student academic progress, behavior, learning support, and so on. The general idea is to collect this data at the end of the year so that it could be used for creating classes for the following year. Post-it notes, hand-written lists, charts, spreadsheets, you name it. They have all been used in a variety of ways to collect this information.
How it used to be
There are a number of key factors that have been consistent with any system. Keeping track of boys and girls, academic needs, and behavior needs have been standard issue. Over the years, some other things that have come up have been related to whether or not students received certain support for ELL, math intervention, English intervention, or speech and language support. In my current school, which is heavily resourced, we have also started looking at social-emotional needs world language levels, overall strengths and goals, and what we refer to as HAPs – highly active parents.
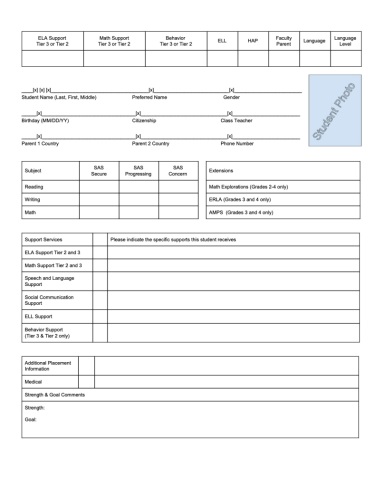
Historically, these data points were collected from the classroom teacher and learning support teacher, where necessary. Teachers entered information into our LMS (learning management system). This was then printed out on to a paper form and distributed to teachers in August once classes were decided. Teachers used this information to get a quick snapshot of their students. This was great for individual student information. However, once the school year started, the cards usually get put up on the shelf and sit there until the end of the year when they need to be shredded.
The reason for the shift
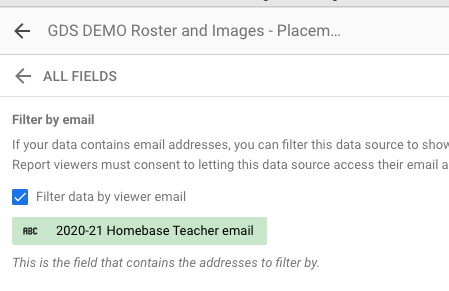
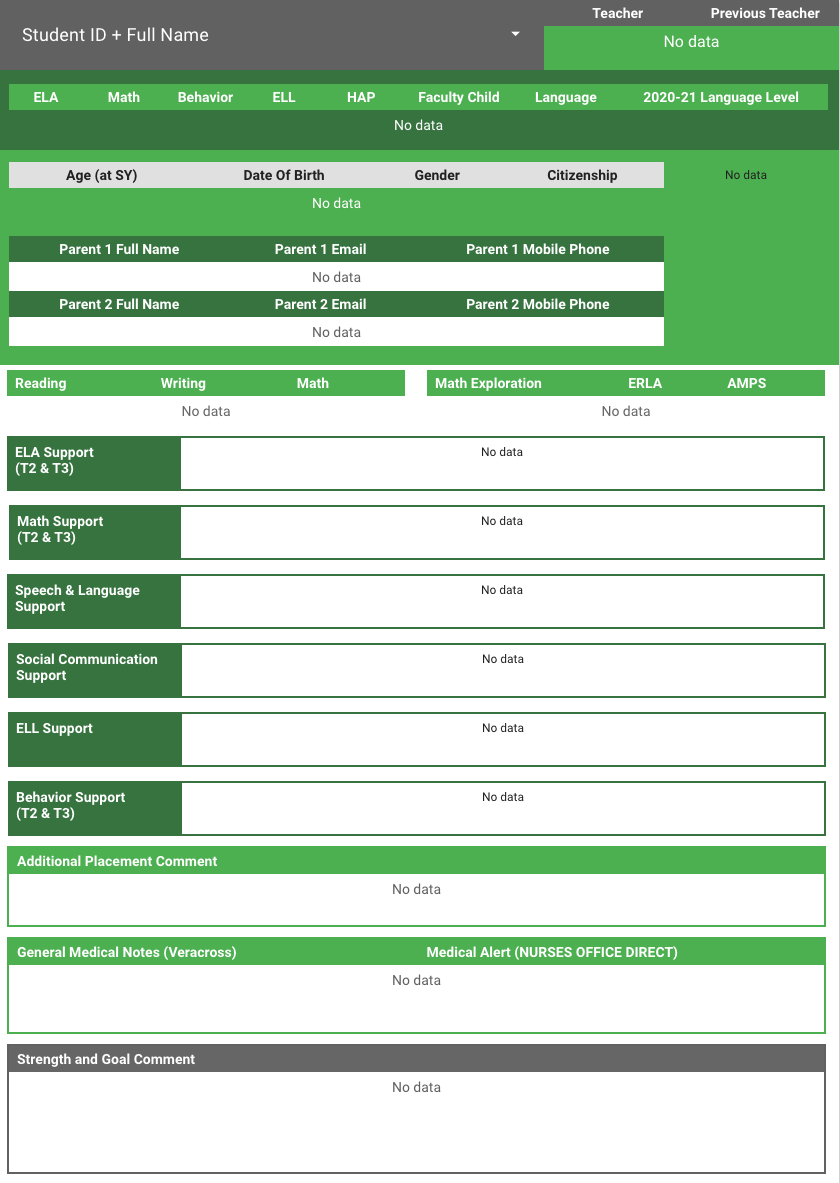
Given the current situation (2020), we have been forced to find new ways to work, share, learn and communicate. With the possibility of not being able to teach and learn in person, I was asked to look at a way we could share this information digitally. Confidentiality was one of the most important concerns. The school did not want to just create a shared folder with all student information in it. They wanted a way to share the right information with the right people. I decided to take a look at creating this in Google Data Studio. The reason for choosing Data Studio was because of the ability to lock down a report and have it only display data relevant to the person logged in. This feature is known as “filter by email.” Simply put, once your dashboard is set up, you can choose the column with the email address in it to be the filter. When a person signs in via the link, they will need to allow Google to access their information. Once this is done, only the rows with their email associated will be populated in the dashboard. If someone else gets ahold of the link and logs in, but has no email associated with any of the data columns, the report will load, but it will display “no data.” This ensures that sensitive data is displayed for only the people that should have access.
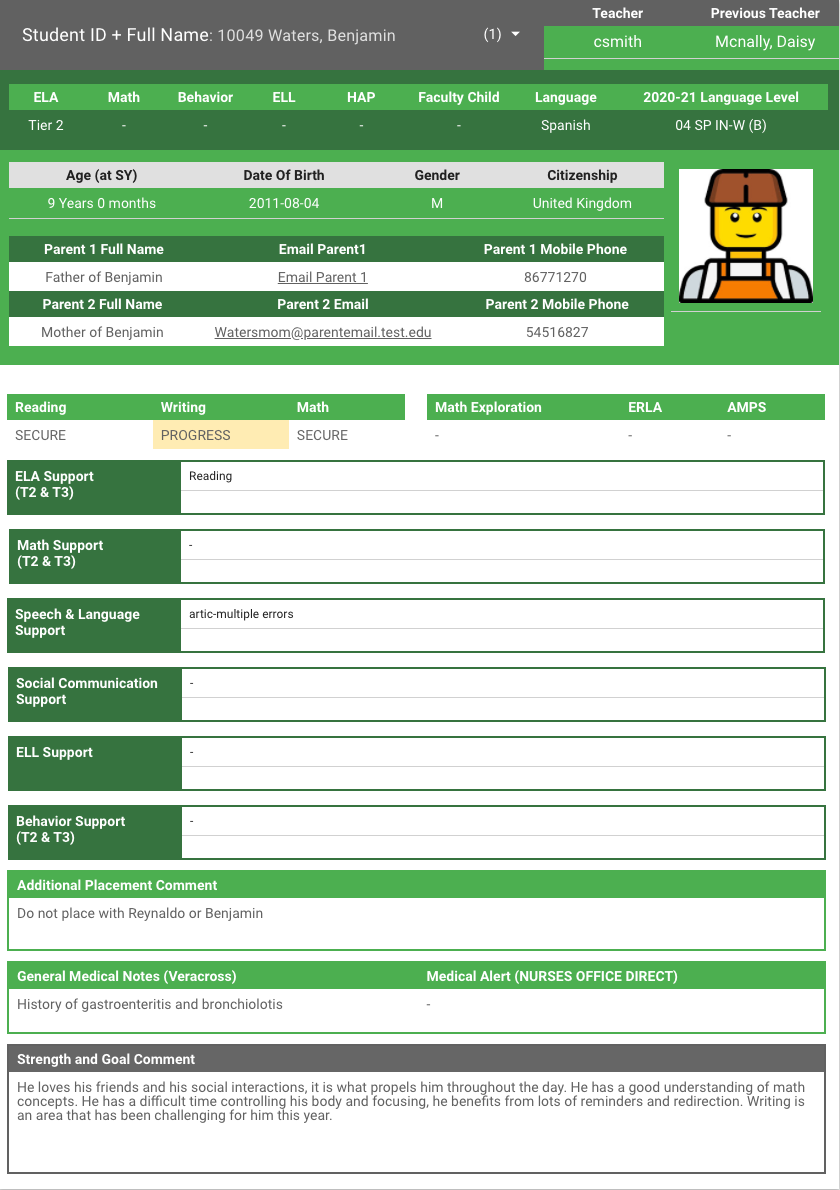
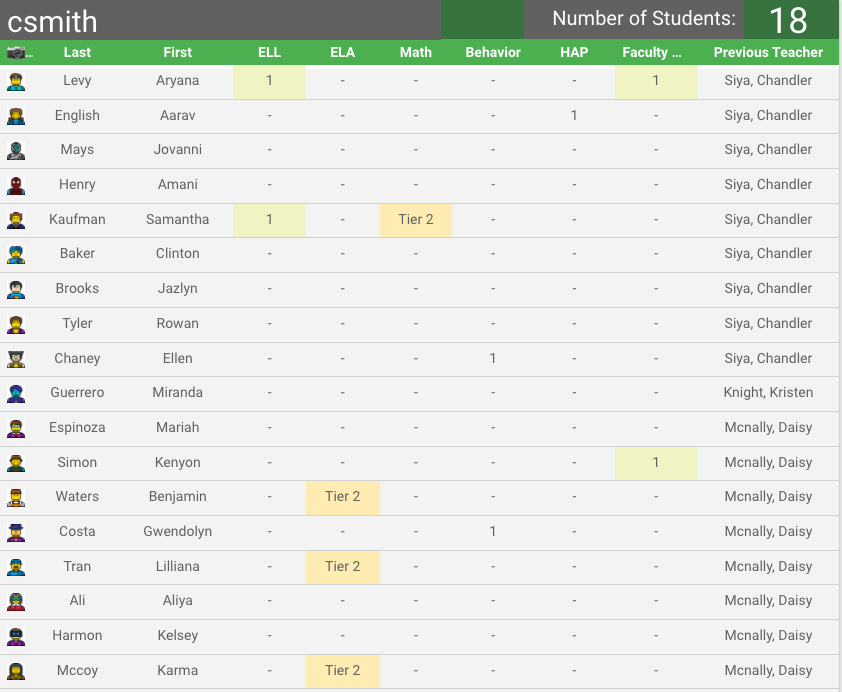
Creating these dashboards allows for a classroom teacher to log in and see only their students. They do not need to go through filters to find their class or navigate through various spreadsheet tabs. The information they need is automatically populated for them.
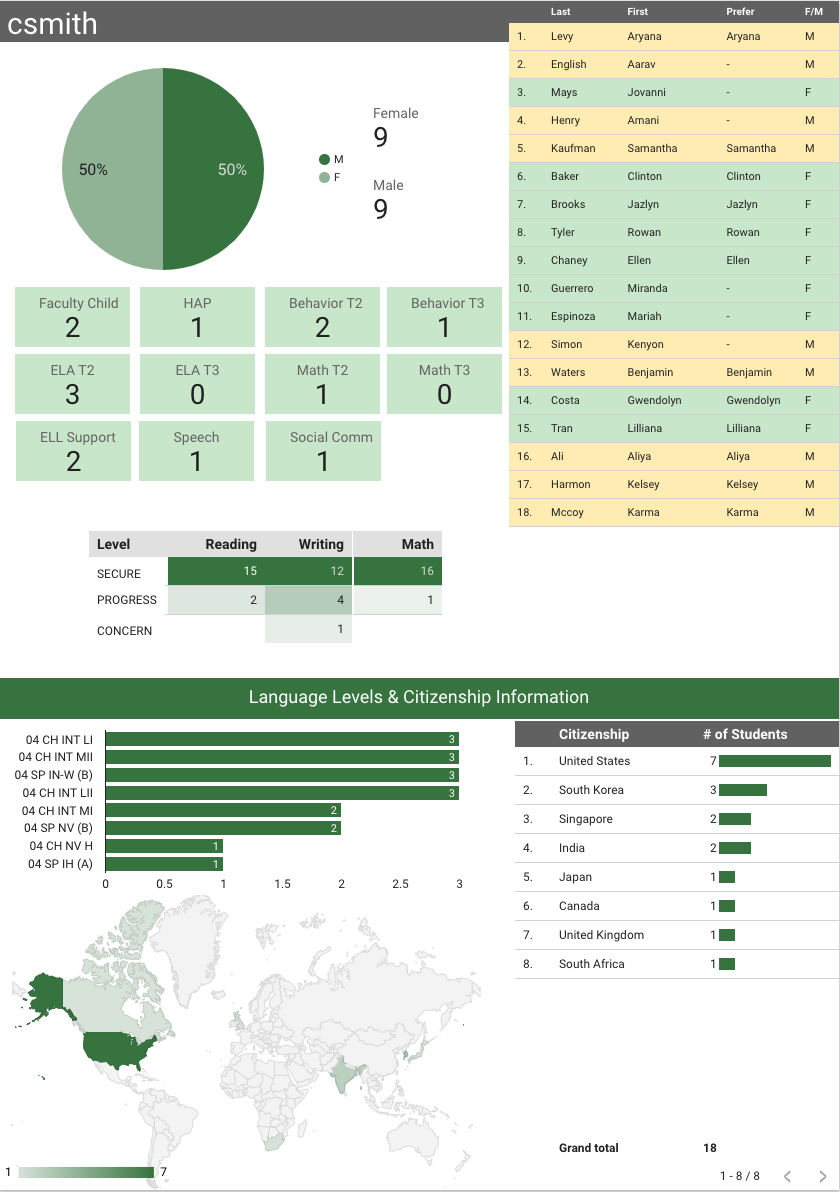
Administrators and individuals such as learning support teachers and counselors, who work with the whole school have access to another report that shares the entire grade level contents. In this dashboard, a principal can go through and select a certain class that they would like to see. A learning support teacher can go through and select the students from various classes that are on their caseload. This will then display only the data for those students.
The good that has come out of it
For some people, having physical paper cards in front of them to sort and organize as they put together classes or as they take a look at their classes. Given the fact that we could not confirm we would be meeting face to face, we had to look at making these digital. My first priority was to make the digital version as similar as possible to the printed version. I wanted to make sure there was familiarity with the placement cards.
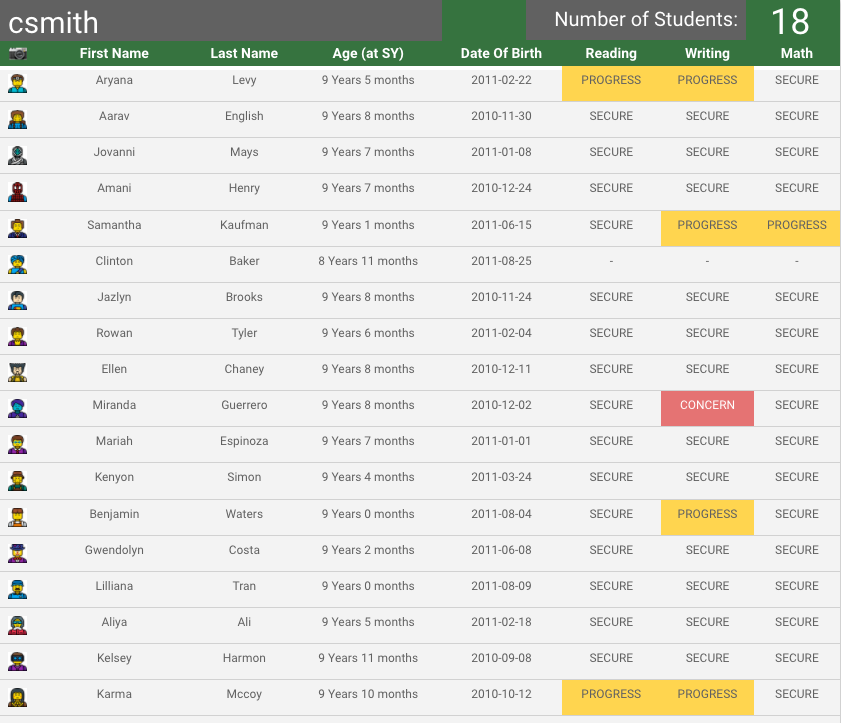
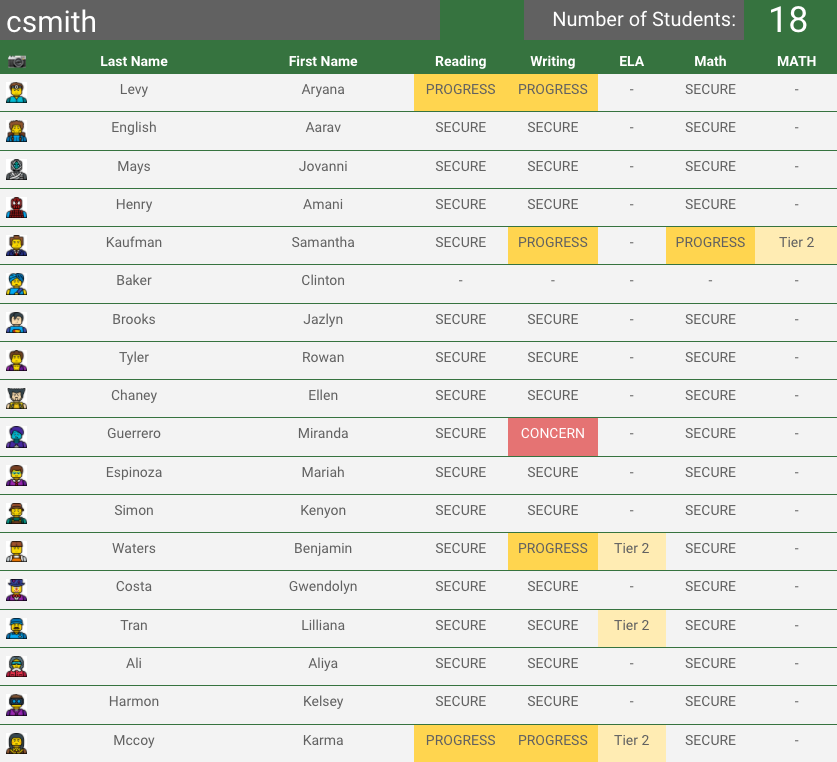
The next thing I did was to think from the perspective of a classroom teacher and decide what kind of information I would like to know at the beginning of the year. One thing I used to do was shuffle through the papers and create my own spreadsheet entering in all academic information so I could see the academic status of my class at a glance. I decided to go ahead and make this as an optional page view. I then remembered how important it was to know the age of the students and the birthdays of the students in the class. Even though a teacher might have a class of all “grade three” students, that doesn’t mean they are the same age. Knowing who is the youngest in the class and who is the oldest in the class can help put some student actions in perspective. It also helps for creating certain groupings. In addition, a good teacher will also have birthday information displayed up on the wall somewhere. So, I also created a version for birthdays and ages.
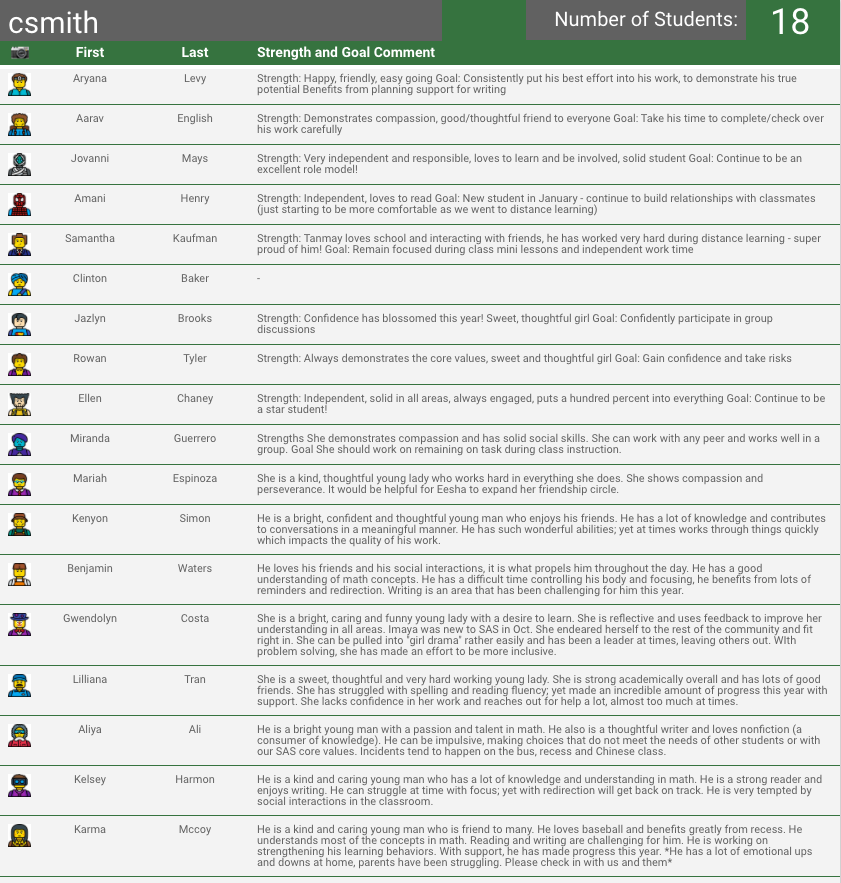
After my initial version, I decided to get some feedback and input from classroom teachers and counselors. I spent one week going around and surveying other staff members. I tried to get feedback from teachers that worked with our youngest kindergarten students all the way up to our oldest fifth grade students. In addition, counselors also provided some input and suggestions. I went ahead and made some modifications by creating additional page views. Teachers and administrators have been very pleased with the results.
Moving forward
As students are accepted to our elementary school or as families withdraw, we are able to update the information automatically. We have also been able to weave in our learning support teachers by having them make sure the data we have is accurate. If anyone that has access notices inconsistent information, it can be updated almost instantly. Teachers can also download pages and export to Google Sheets, save as a csv file or print off as a PDF file.
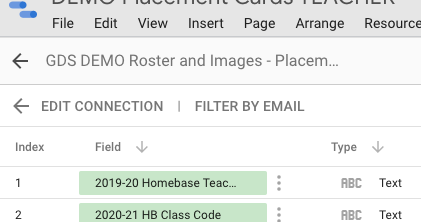
As we continue along on this journey, some suggestions by teachers has been to create different page views for learning support and speech & language teachers. Another request is to make the dashboard accessible to specialist teachers. Since specialists in our school work with multiple classes, setting up the logistics on the backend will take some time. Essentially, this would mean creating an additional data set with connecting to the original data set connected by a primary key. The primary key would most likely be the name of the class. For example, G1Smith. Then, any teacher that works with students from G1Smith will have access to that class list.
Here is an interactive demo file, if you want to check it out. The filter by email option has been turned off so anyone can access and browse. This is similar to what an administrator or counselor might see. I’m sure there are other items or page views that could be beneficial. If you have any suggestions or requests, please send a message on twitter. I look forward to getting your input and ideas.