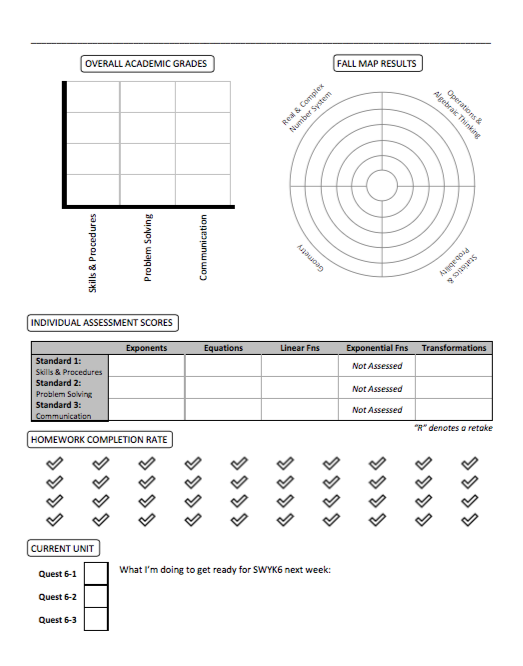
Report cards are bland and only show summative data. I created this infographic template (which is essentially just a coloring book page) for student-parent conferences as a way for students to articulate their progress on more than just report card grades.
This activity had secondary benefits of helping our parents gain a better understanding of standards-based reporting, making my students more aware of their own data, and acting as the introduction to my statistics unit.
Here is the .docx file for you to take, use, and tweak:
Year in Data Infographic (.docx file)