
We know that many students around the world have suffered physically, academically, and mentally as a result of prolonged periods of COVID-related lockdowns. But, to what extent, is this true? What factors might be associated with this extent?
I have used Qualtrics to help answer questions like these at my school.
Qualtrics provides advanced, yet easy to use, survey-based data services for educators wishing to make smarter decisions and who want to glean novel insights into their school community.
Qualtrics is great for many reasons but let me share just two. The beauty of one feature, called ‘Crosstabs’, is that it allows you to reconcile results from two different questions. For example, I recently surveyed my students on a variety of topics related to remote learning. With two particular questions, I wanted to know, first, the extent to which students believed :
- the volume of time spent in lessons and working on assignments during remote learning had increased, decreased, or stayed the same; and,
- their mental health during remote learning had also either increased, decreased, or stayed the same.
The results received for each question were pretty straightforward: respondents generally reported increases on both measures. Just as nice is the ability to see how each Grade answered such questions, as show below:
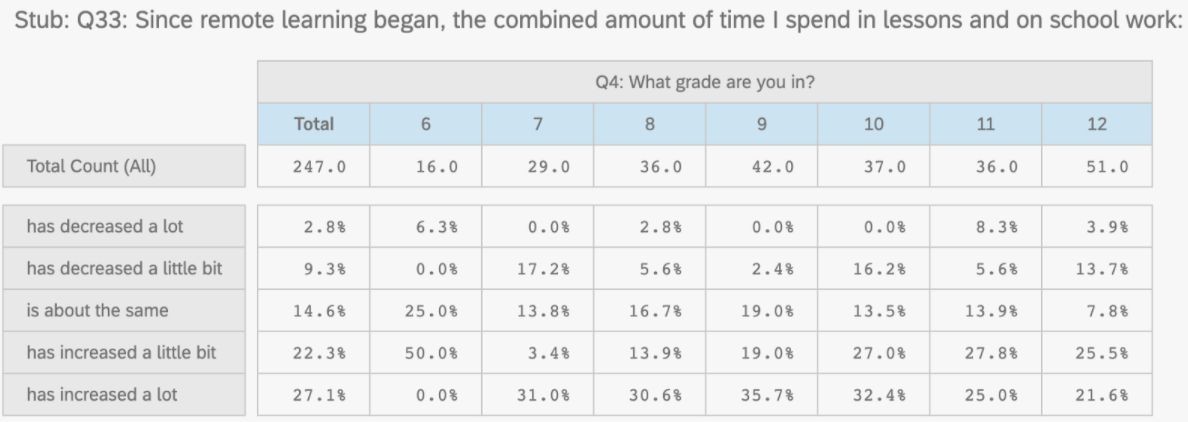
Clearly, most students in each Grade reported a general increase in the amount of time spent in lessons and on school work during remote learning as compared to on-campus learning. However, I remained interested in knowing the percentage of respondents above who ALSO reported an associated change in mental health challenges.
Using Qualtrics’ Crosstabs feature, I was able to explore a relationship between volume of work and mental health. The results were pretty interesting, to say the least.

This means that, of those who said that the amount of time spent in lessons and on school work since remote learning began ‘has increased a lot’, 61.3 percent also said their mental well-being since remote learning began ‘is much worse’. It is also possible to categorise these results by respondents’ Grade.
The realisation that about 40 of my students needed immediate attention kickstarted a flurry of meetings and discussions that have included students, parents, faculty, and board members. Of course, worsening mental health does not mean poor mental health. It does mean that these students are doing ‘less well’ than they should be.
In the short term, these findings prompted the formation of a Mental Health Task Force consisting of students, parents, faculty, including counsellors. Our counsellors can now make more informed decisions when prioritising their time. In the medium-term, we can compare changes in responses year-on-year. In the longer-term, findings can help with decisions related to resource allocation, staffing, and budgeting.
However, how would I have known to take these actions and considerations without using Qualtric’s Crosstab feature? I cannot overestimate the value of it. Still, Qualtrics has many more. Let me give you one more example.
I was also interested in learning how much physical exercise my students were getting during a recent, extended period of remote learning. I first looked at the following simple results:
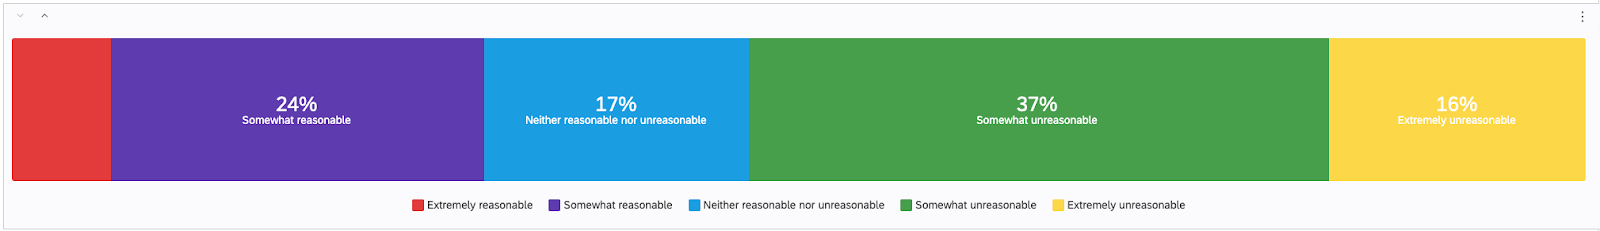
This indicates that students were not getting a reasonable amount of daily exercise at the time. However, I also wanted to know the relationship of these responses to students’ self-declared sense of happiness. I suspected that students getting the most exercise would also report relatively higher levels of happiness. I used another Qualtrics feature called ‘Stats iQ’ to test my hypothesis. All I had to do was simply drag the results of each question into two available analysis fields. Doing so gave me the following results below.

Not sure what this means? No problem: Qualtrics makes it easy. By hovering over the shaded circles with the letter ‘i’ in the middle, easy to understand explanations for both P-Value and Effect Size are given. The P-Value explanation given tells me that I can be quite confident in the reported Effect Size’s validity. The latter tells that the effect of daily exercise on student happiness is not large; that it has a ‘medium’ effect. Or, in other words, student exercise at the height of my school’s lockdown, indeed, had a noticeable effect on their happiness. It would be fair to say that my hypothesis has some truth to it. Based on this analysis, I ended up letting students, parents, and teachers know in various contexts that students getting daily exercise at the height of our most recent lockdown were adding benefits, not only to their health, but also to their happiness. Has this enabled parents, and students themselves, to make better decisions? You betcha!
We can make data analysis as complicated as we want. But it can be quite simple, too. Qualtrics just tells you what you need to know. It has many other features which I may share in the future but I hope this article has piqued your interest. Full Disclaimer: I receive no financial benefit for touting the benefits of using Qualtrics. But maybe I should! Nonetheless, I would love to learn more about how other educators are also using Qualtrics to improve decision making and experiences for their students, parents, and teachers. Get in touch with me!
By Timothy Veale (Secondary Principal at International School of Hamburg)