

One of the most worrisome parts about Big Data in schools is the unethical targeting of teachers based on single data points — often misused. It’s therefore imperative that specialists, well-versed in statistics, are present for data based conversations. Here’s a great example:
NWEA MAP “Achievement Status and Growth Summary Report”
No doubt my least favorite data report generated for administrators is the Achievement Status and Growth Summary Report. It contains this little gem:
![]()
Feels a little judgy, doesn’t it? It makes people ask questions like, “Why aren’t all students meeting their projections? Why only 42%?”
But this is misguided. We would expect teachers to have approximately 50% of their students exceed the projection, and 50% fall short. In a normally distributed population, the mean is at the center of the distribution like so:
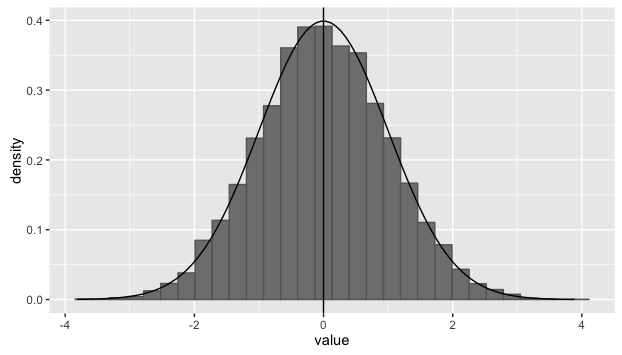
We can see that approximately half of our distribution is to the right of the vertical mean-line and half is to the left. But bringing in the emotion of thinking about “students meeting their potential” makes us think that all should be hitting their projections.
If we have to compare…
A better way to compare – but I don’t recommend doing this sort of comparison- would be to run hypothesis tests. We could then see if we should consider this difference due to normal chance, or to a specific treatment.
We will set µ=6 and σ=6.55, since this is given to us by NWEA as the mean and standard deviation of growth. We design our test as follows:
H0 : x̄ = µ
HA : x̄ ≠ µ
test type: t-test
α = 0.05
For exploratory purposes, lets look at a normal distribution with µ=6 and σ=6.55 compared with our sample mean:
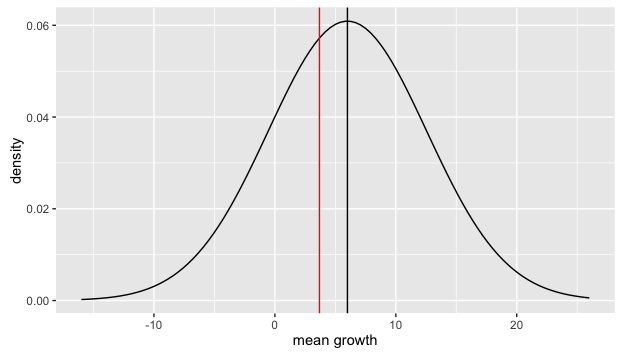
At this point, I’m pretty confident that the sample mean is well within our 95% t confidence interval. If it wasn’t, I would expect to see that red line out in the tails of the distribution. We can continue with R’s t.test function:
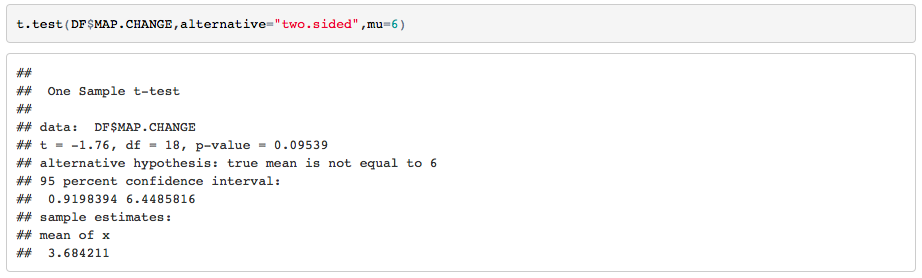
We end with p=0.095 so we fail to reject the null hypothesis at the α = 0.05 significance level.
See? Stats to the rescue!
But truthfully, I wouldn’t recommend running a bunch of t-tests on teacher results. That could quickly turn into a witch hunt and leave teachers feeling like we’re looking for a problem.

Disclaimer: The data and graphics used on this site are simulated re-creations intended to protect the privacy of the original data sources.