

As we moved to Standards Based Reporting, the emphasis on summative feedback increased, whether intentionally or not. Unfortunately that meant our formative feedback tracking became a little inconsistent. So I had the idea (as many teachers do) to have the students self-track and self-report.
But I added a data twist: We did our tracking in a google sheet and I used that sheet to teach them basic spreadsheet functions, to make visuals and tell the story of their learning. They learned skills like Reproducibility and choosing appropriate graphics to convey their messages.

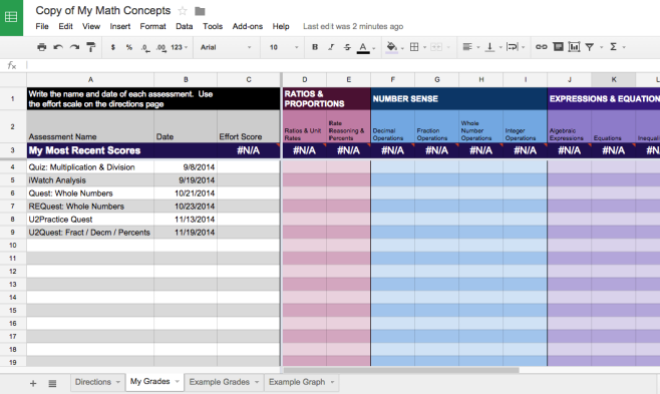
The sheet is pretty self explanatory: after any quiz, test, retest, formative, or summative checkin, students record the name of the assessment, the date, and their grades under the appropriate columns (which align to common core standards at our school). One quick key about management: I had students open this sheet right before they took an assessment and record their effort scores rather than after. It was a judge of their confidence going into the assessment.
At quarters and reporting periods, I then had students pick a column (like effort or ratios) and create a graph to post on their eportfolio, along with a story.

Example portfolio posting
I felt really strongly that this ongoing conversation about data supported their vision of themselves as learners and many of the students shared their data in their student-led conferences at the end of the year. The data doesn’t lie, and students used the data to show their progress, and to take responsibility for their own growth.
I also found that it supported my data unit. When we got to our data and statistics unit, I found students ready to read and tell the story of data (more on that in future posts). I emphatically believe data literacy will be a quint-essential 21st century – and 22nd century – skill.
You can find a copy of my data sheet for your own tweaking below. the only formula I’ve inputed is in the “Most Recent Score” column, but that’s because we’re a standards based school who looks at recent trends in scores rather than averages. If instead you find a different formula more valid, I encourage you to edit that line so the student can get a snapshot of their progress.
Here’s the template. Share, copy, download and distribute at will!

Disclaimer: The data and graphics used on this site are simulated re-creations intended to protect the privacy of the original data sources.