

Likely at your school, you have certain benchmark points in the year when you are collecting large amounts of data. You might collect Standardized test scores in the Fall, Winter, and Spring; you might have final exams at the end of the year; or you might have quarter and semester grades happening at specific intervals.
Each serves a specific purpose.
Looking at Fall Data is about getting to know your students
Fall is not necessarily the time for cohort tracking or making program judgments. Fall is the time to find differences in the population of students occupying the seats in front of you. Dig into the data and get to know them better, predicting times when support may be needed, and focusing your instructional strategies to those that match your demographic.
Wait until Winter and Spring for cohort tracking, progress mapping, program judgments, or other achievement indicators.
Here’s an example:
We tracked Fall standardized test scores over 5 years to compare this year’s 9th Graders vs the previous five 9th grade classes. This looks like a lot, but we will break it down.
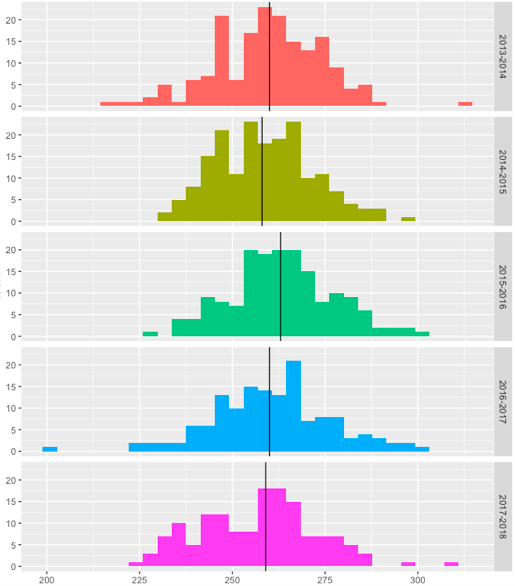
Each graph represents a 9th-grade class who has taken the same standardized test. We’re looking at histogram that shows the grading distribution.
The red graph is from 5 years ago, while the purple graph is this year’s 9th graders. The black lines are the mean scores.
Our goal now is to learn from their story.
What initially comes to mind is that the purple graph has less variation than the previous year. We have a couple high outliers, but for the most part, the spread is reduced. The black line has shifted lower, but it’s not significant in comparison.
How does this inform our practice? With a smaller spread, this means the teacher can devote less time to differentiation and more time digging in where the students are at together. There are a few high outliers, where the scores are well above their peers and those students should be identified and given extensions.
Disclaimer: The data and graphics used on this site are simulated re-creations intended to protect the privacy of the original data sources.