

Over at YouCubed, Jo Boaler and the team have released the second edition of the “Week of Inspirational Maths” (WIM). The lessons promote mathematical growth mindsets, dispel discouraging myths about learning, and give engaging tasks with access points for all learners.
We’ve been having a blast engaging in the activities, but one has caught the attention of a budding young data scientist. Lesson 4 of WIM2 is aptly titled “Conjectures, Creativity, and Uncertainty” and has students engage in a Hailstone sequence (also known as “wondrous” numbers).
For those that don’t know, Hailstone sequences are generated with the following rules:
- Start with any positive integer
- If the number is even, divide by two
- If the number is odd, multiply by 3 and add 1
- Repeat
Here’s an example: 20, 10, 5, 16, 8, 4, 2, 1, 4, 2, 1, 4, 2, 1, 4, 2, 1…
I asked the students to form conjectures about the sequences made with Hailstone rules. Eventually, they landed on Collatz’s conjecture: that no matter where you start, the sequence will eventually reach 1.
But THIS IS AN UNPROVEN CONJECTURE! So I asked them to find a counterexample… of course this is a devious question because so far no super computer has found a counterexample. And here is where my data scientist emerged…
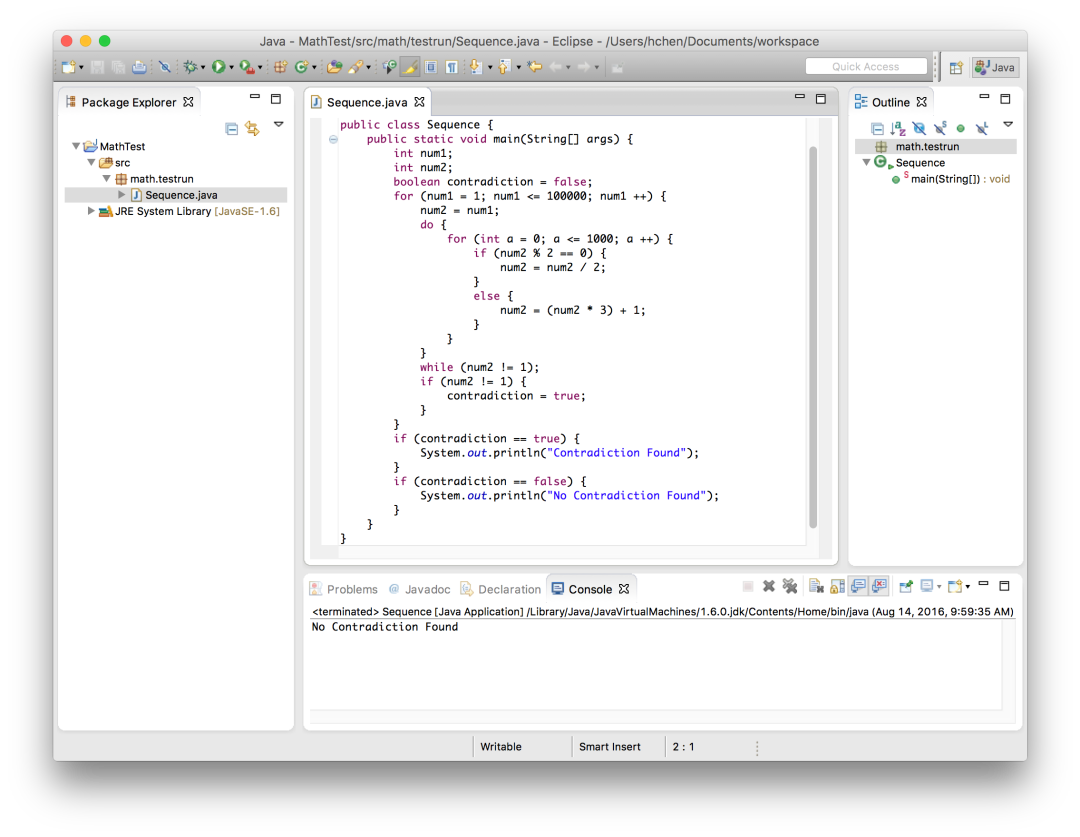
I received an email from a student who wrote a java program to test the first 10,000 integers. His results? No contradiction found. Here’s a screenshot of his code with the results at the bottom.
I was impressed! And the gauntlet had been thrown! I sent back my own R Code that creates a “Collatz” function that can test however many integers you want:
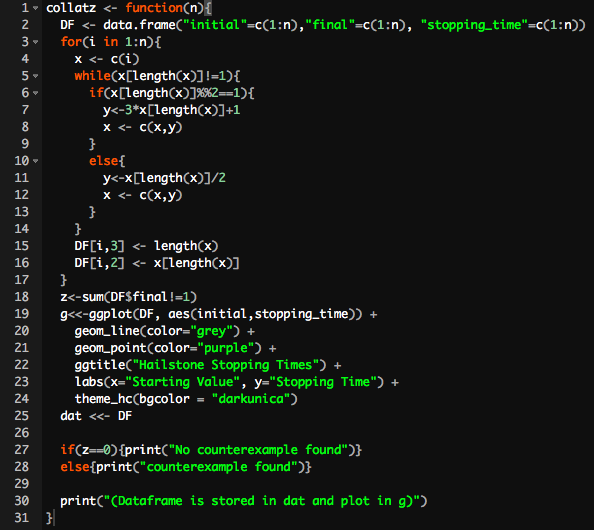
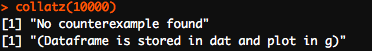
Checking for the first 10,000 integers I got:
You’ll notice a plot is involved. Our code discussion led to talking about “stopping times” — the number of terms in a hailstone sequence before it lands on 1. I decided to graph it which led to a new conjecture by my students: as the starting point increases, so does the stopping time.
Awesome discussion here as some high numbers have very short stopping times while others have much larger. But a little code addition and you can graph the oscillating stopping times with a smoother.
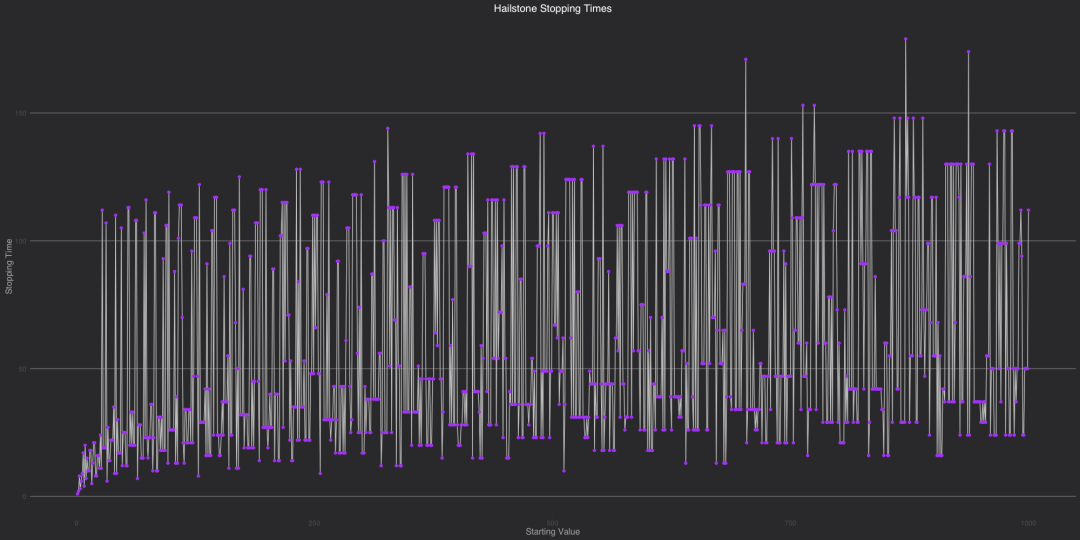
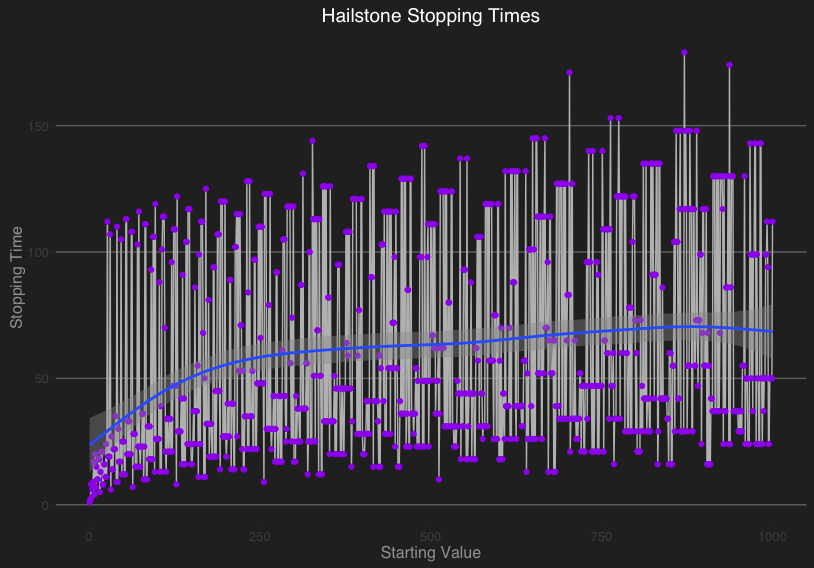
And they were correct! At least when looking at the trend, it seems that stopping times are increasing! This is the power of the minds of 8th grade students when getting the opportunity to look at data visually.

Disclaimer: The data and graphics used on this site are simulated re-creations intended to protect the privacy of the original data sources.