

It’s a common question: are we grading equally? And while I don’t like the focus on marks, I can appreciate that calibrated grading ensures proper feedback, helps create a shared vision of the purpose of an assessment, and yes, even helps avoid some potentially heated discussions with parents.
As usual, we will take a look at a real life example. For grading calibration, I like to look at density plots – think of them like bar plots or histograms, but with a curve rather than bars.
Here is a group of teachers who all teach the same grade:
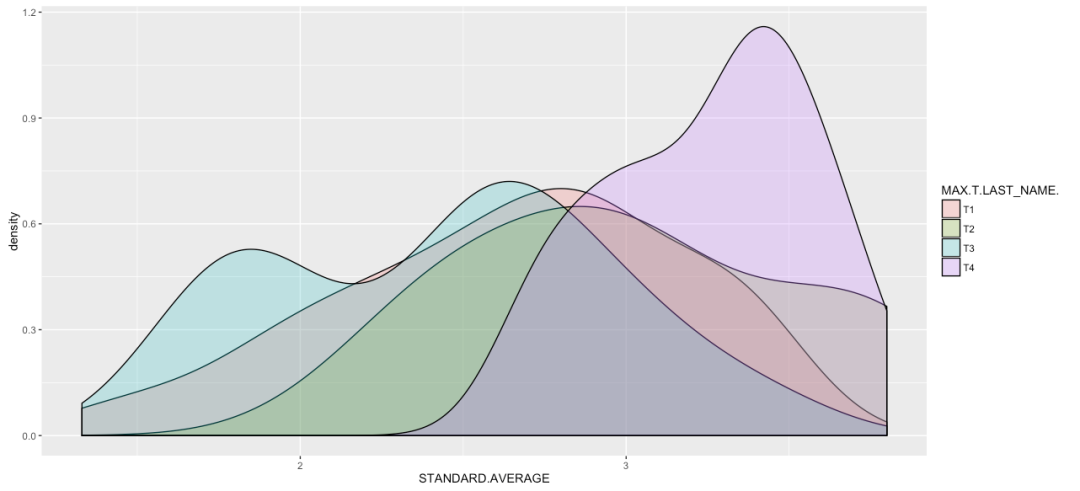
For calibration, you want the peaks to be in the same place with a similar taper to each side. And the first question might be – are they all teaching the same class? And while they are all teaching grade 7, there are different courses within grade 7.
We will focus on that purple graph (which has magically turned blue below) and isolate it with the other teacher who teaches the same class:
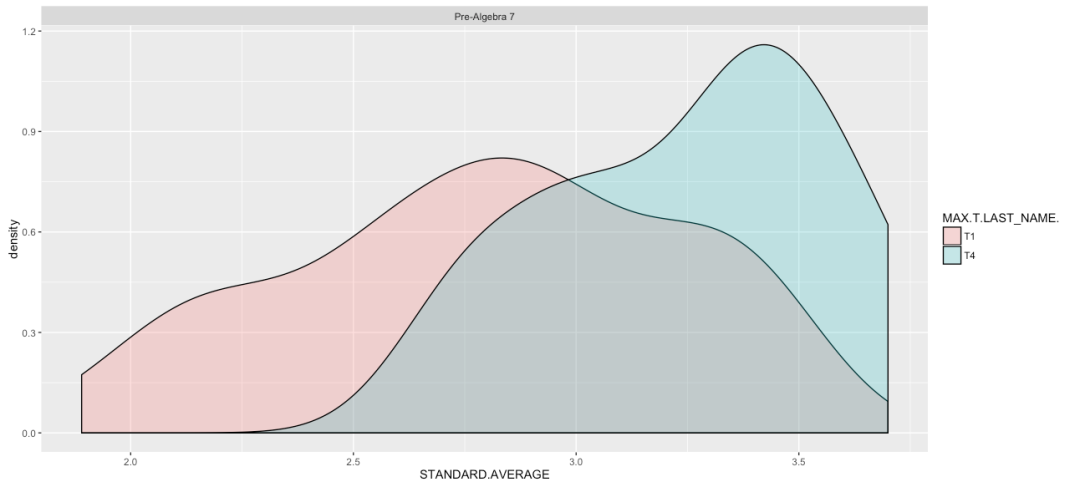
We now have two teachers who teach the same class with wildly different results. One teacher has an average grade around a 2.9 (this is a standards based system) with a symmetric distribution; the other has an average around 3.3 with the large majority of grades above 3 points.
Your next action and how we then approach this is perilous: The wrong questions to ask are: Why does Teacher 4 have inflated grades? Why does Teacher 1 grade so hard? Why aren’t more of Teacher 1’s kids reaching a higher standard?
As you can see all of those are loaded questions and will shut down the conversation.
If we go back and look at the Grade 7 teachers as a whole, it seems that indeed Teacher 4 is different than all the others, so we will move the focus there. We can ask the following questions: How are you able to get your kids to such a high level? What classroom procedures and teaching practices are facilitating this shift? Should the whole team be doing the same?
The focus here is on the positive aspect of the change – validating Teacher 4’s practice as worthwhile and opening the conversation further rather than shutting doors. The culmination of this story is that Teacher 4 had a procedure around retakes that made it easier to reach a level 3. This led to a discussion around setting a shared vision on assessments and retake policies department-wide.
Good data doesn’t solve problems; good data creates opportunities for growth and shared vision.

Disclaimer: The data and graphics used on this site are simulated recreations intended to protect the privacy of the original data sources.