

Data should empower. Data should provide insights. Data should inspire more questions. Without a positive framework, capacity building, and expertise – data is often thought of as scrutinizing, overly subjective, and a burden.
So let me propose my model:
Listening
We have to start by trusting teachers to be the well versed experts that they are. If a teacher is noticing something – it should carry weight. Use what they notice to leverage action that meets their interests.
Questioning
What might be the reason behind what we are noticing? What data would show this? This stage should include data decisions like developing collection techniques or just finding where it already exists.
Analyzing
Gather the data – eg. collect it from surveys, aggregate from our data sources – and develop visual models (with the help of a data coach). A good visualization should allow for rich conversation and insights.
Deciding
Does the data support what we’re noticing? Does it call for new action? Who should be made aware of what we found?
Then lather rinse repeat – or jump back and forth between the steps. This process should lead to more questions. Beginning with listening puts the power of the data relationship squarely in the hands of the people closest to the data – the teachers. Are there more steps than I’ve listed? Of course – but that’s for our inner data nerd. The goal of this model is accessibility.
Lets run an example:
Stage 1 – Listening and Noticing: In a recent department meeting, I heard a partner teacher struggling to reach learners in their classroom.
Stage 2 – Questioning: The question we came up with, “Are students entering my course at a wide range of ability levels? Or are my lessons not reaching different types of learners?”
Stage 3 – Analysis: We looked at MAP scores for that class when compared to the grade. The green density plot is the entire grade while the purple density plot is the one class.
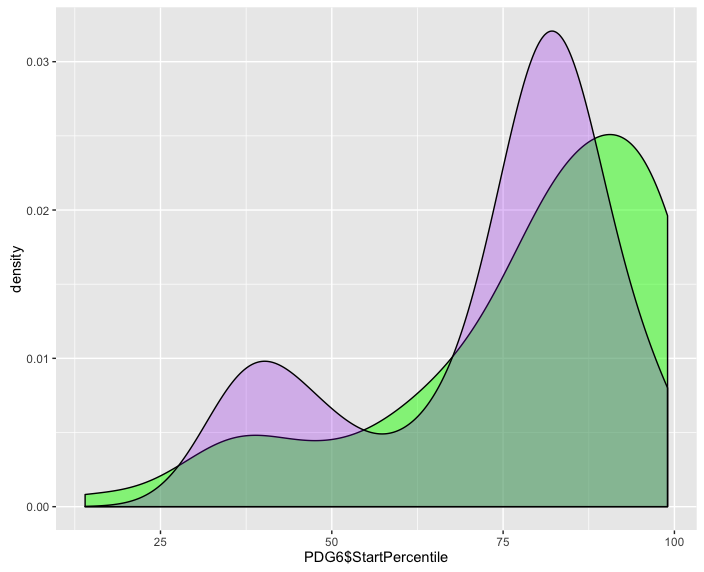
Look at the density plots and you can see there are clusters of students at differing achievement levels. It’s safe to conclude that there are two distinct groups of student achievement in one class. Since this is entry data – it’s not a result of the teacher.
Stage 4 – Action: The teacher’s action and personal resources can now be focused on differentiation rather than learning styles. The teacher could team with a support teacher, learning specialist, or look to discover more about the student profiles who make up the course or make suggestions for future course loads so that the percentile spread isn’t so great.
The entirety of the process is teacher directed and validates what is important to the individual. When the time comes for a nitty-gritty-data-dive, the coach steps in to shoulder the administrative quagmire that dissuades so many from action research. Most importantly, it begins with listening to the people that are closest to the data.
Here are some more possibilities:
- PE Teachers are curious if heart rate monitors lead to more active engagement
- Math Teachers are wondering if recent shifts have shown an upward trend in performance
- Curriculum leaders want to check for grading calibration
These are questions that are easily running around at our schools yet how often do we engage in a simple process to answer them? A model like this is meant to stoke the flames of passionate inquiry, not quench them.

Disclaimer: The data and graphics used on this site are simulated re-creations intended to protect the privacy of the original data sources.